The hypothesis that did not want to die
Wherever you look in modern finance, one concept permeates everything. You cannot escape the Efficient Market Hypothesis (EMH). From Modern Portfolio Theory to derivative pricing, to everyday finance jargon terms such as alpha and beta, the inevitable assumption is that markets are efficient. Prices reflect every information available - investors cannot generate superior returns other than by luck or by taking more risks.
But when we look at reality, things are not so clear. How accurate is the Efficient Market Hypothesis? Can we really assume that markets are efficient - or at least, efficient enough that investors cannot generate excess returns? What are the consequences for investing strategies?
The Efficient Market Hypothesis exists in various forms, each one being more or less restrictive. For instance, the Strong Form of the Efficient Market Hypothesis claims that all existing information, public and private, is reflected in all asset prices at all times. It follows that no investor can possibly gain any advantage by trading an asset based on insider information.
Well, at least this form is easy to refute: Insider trading is a criminal offense in most countries for good reasons. In November 1986, Ivan Boesky - one of the most famous investors at the time - was arrested and charged for insider trading. He had entered an illegal arrangement with Martin Seigel, an investment banker from Kidder, Peabody and Co. Between 1982 and 1986, Boesky paid Seigel around USD 700’000 to have access to inside information about the bank clients’ pending corporate transactions. The stock price of the client companies moved sharply when their corporate deals became public, and Boesky netted USD 33 million thanks to Seigel’s information over this period. He did a similar arrangement with Denis Levine, an investment banker at Drexel Burnham Lambert, which made him more than USD 50 million in profits. Because Boesky seemed to hit home runs on almost every M&A deals in the 1980s, the SEC realized something was fishy and started investigating. Ivan Boesky pleaded guilty, served two years in jail and was fined USD 100 million. This story illustrates how private information can give a material advantage to any investor acting on it before it gets published. The strong form of the EMH does not stand up to scrutiny.
That’s where the Semi-Strong Form of the Efficient Market Hypothesis comes in. This variant claims that current asset prices reflect all publicly available information. No amount of fundamental analysis based on public information can give any edge to any investor. As the saying goes, nobody can beat the market, except by sheer luck or more risk-taking. The consequences are profound. If the hypothesis is correct, then the asset prices reflect asset values and do not offer any arbitrage opportunity.
This sounds reasonable, but how well does it fare against reality? There are two ways to figure out if this EMH form is valid. We can try to find investors who generated superior results for a prolonged period or time. We can also try to isolate past market behaviours were it was obvious that markets were dislocated and price diverged materially from value. Both approaches lead to interesting results.
Enter the Hall of Fame
In Excess Returns: A comparative study of the methods of the world’s greatest investors (Harriman House, published in 2015), Frederik Vanhaverbeke dresses a selection of investors who outperformed materially the S&P 500 Index for significant periods. Here is an extract of his findings, sorted by outperformance longevity:
| Name | Track Record (Years) | After-Fees CAGR |
|---|---|---|
| Warren Buffett | 56 | 20% |
| Philip Carret | 55 | 13% |
| Walter Schloss | 49 | 20% |
| Shelby Davis | 45 | 22% |
| T. Rowe Price | 38 | 16% |
| John Templeton | 38 | 15% |
| George Soros | 34 | 29% |
| Arnold Vandenberg | 33 | 16.6% |
| Peter Cundill | 33 | 15.2% |
| John Neff | 31 | 14.8% |
| Edward Thorp | 29 | 19.8% |
| Michael Steinhardt | 28 | 24.7% |
| Anthony Bolton | 27 | 20.3% |
| Bruce Karsh | 25 | 23% |
| Tom Claugus | 25 | 21% |
| Glenn Greenberg | 25 | 18% |
| Seth Klarman | 25 | 16.5% |
| James Simons | 24 | 34% |
| Lou Simpson | 24 | 20.3% |
| Tom Russo | 24 | 15.8% |
| Paul Rabar | 23 | 25.5% |
| Liz Cheval | 23 | 23.1% |
| Jerry Parker | 23 | 22.2% |
| Tom Shanks | 22 | 29.7% |
| Marty Whitman | 21 | 17.2% |
| David Bonderman | 20 | 30% |
| Michael Marcus | 20 | 48% |
| Randy McKay | 20 | 41% |
| Robert Wilson | 20 | 34% |
| Julian Robertson | 20 | 25% |
| Benjamin Graham | 20 | 21% |
| Richard C. Perry | 20 | 20.8% |
| B. S. Sherman | 20 | 19.6% |
| Joel Greenblatt | 19 | 45% |
| Rick Guerin | 19 | 33% |
| Paul Tudor Jones | 19 | 26% |
| Martin Zweig | 19 | 25% |
| Sim Abraham | 19 | 21.7% |
| David Einhorn | 19 | 19.4% |
| Eddie Lampert | 16 | 29% |
| Louis Bacon | 15 | 31% |
| Prem Watsa | 15 | 20% |
| Tom Knapp | 15 | 20% |
| George Michaelis | 15 | 18.4% |
| Daniel Loeb | 15 | 17.6% |
| Francisco Garcia Parames | 14 | 22.5% |
| Bill Ruane | 14 | 18% |
| William Eckardt | 13 | 60% |
| Peter Lynch | 13 | 29.2% |
| Stan Perlmeter | 13 | 23% |
| Gil Blake | 12 | 45% |
| Stanley Druckenmiller | 12 | 37% |
| Jeff Vinik | 12 | 32% |
| Richard Driehaus | 12 | 30% |
| Charlie Munger | 12 | 24% |
| Jack Dreyfus | 12 | 17.7% |
| Jim Rogers | 11 | 38% |
| Scott Ramsey | 11 | 25.7% |
| Martin Taylor | 11 | 22% |
| Steve Clark | 11 | 19.4% |
| Jim Ruben | 10 | 40% |
| Joe Vidich | 10 | 24% |
Vanhaverbeke also charted investor performances against their longevity:
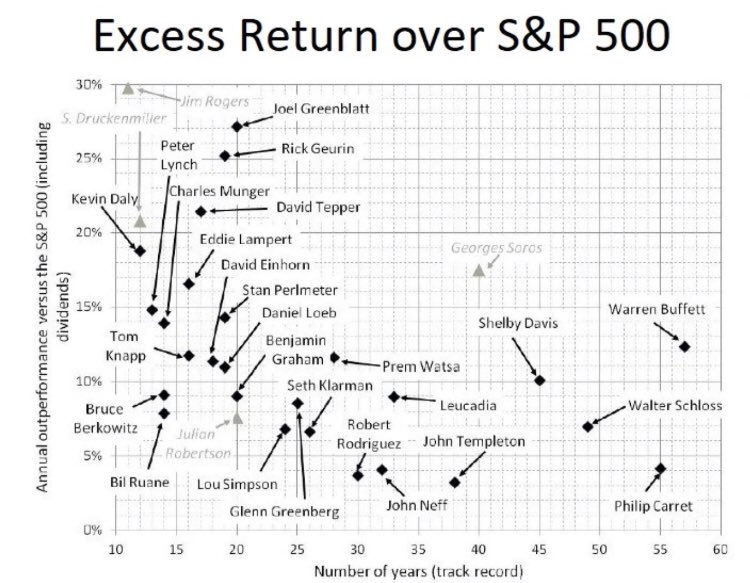
It may well be that some of these investors were lucky. But it would be very surprising if all their track records were due to luck alone. Even more so when the track record is longer than 30 years (Buffett, Carret, Schloss, Templeton, Price, Soros, Davis, Vandenberg…) I am well aware of survivorship bias, but the luck required to generate such returns over such a long term is astronomical. Most market participants won’t beat the market (more on that later), but it looks like a few skilled ones (to only talk about those keeping a public profile) managed to take advantage of it for a very long time.
Mr Market, a manic-depressive fellow
Another way to check the Efficient Market Hypothesis against reality is simply to look for market facts that don’t make any rational sense. Here as well, a close inquiry will lead us to find elements disfavoring market rationality.
Let’s address the elephant in the room: of all market oddities, crashes are the most striking example of irrationality. And what better example than the October 19th, 1987 crash? On this memorable Monday, the Dow Jones Industrial Average Index dropped 22.6% in a single day, while the S&P500 dropped 20.4%. On no particular news, the market valuation of the whole American Economy was suddenly valued one fifth to one fourth less than it was at the previous session. It is difficult to argue that both valuations on Friday, October 16th and Monday, October 19th were absolutely correct and rational. Either the former was too high or the later was too low (or, more probably, both were wrong).
On a more vivid note, it would be hard not to mention the March 2020 market panic related to the Covid-19 pandemic. As an example among many, on March 18th, the Smithson Investment Trust, a fund quoted on the London Stock Exchange, published a Net Asset Value (NAV) of 1099 pence per share. At the same exact moment, those shares were trading at 910 pence per share, a 20% difference. It would maybe have made sense if Smithson’s holdings were made of companies with weak balance sheet and poor profitability, but the reality is at the exact opposite. Smithson holds only companies with high return on capital, strong reinvestment opportunities, and rock-solid balance sheets. Such a difference between price and net asset value was never justified, but the overall market panic created such opportunities.
We don’t need to go to such extremes to find market inefficiencies. Take a normal year (2018), and the five biggest and most scrutinized listed companies at the time: Apple Inc, Alphabet Inc, Microsoft Corporation, Amazon.com Inc. and Facebook Inc. Over the 52-weeks period that made 2018, retrieve the lowest price and the highest price reached by each company, and look at the difference between both:
| Lowest Price (USD) | Highest Price (USD) | Difference | |
|---|---|---|---|
| Apple Inc. | 38.79 | 58.02 | 49.57% |
| Alphabet Inc. | 991.25 | 1285 | 29.63% |
| Microsoft Corporation | 85.95 | 115.61 | 34.51% |
| Amazon.com Inc. | 1189 | 2039 | 71.49% |
| Facebook Inc. | 131.09 | 217.5 | 65.92% |
Most of them had price differences of more than 30% over the period (Alphabet, the exception, was more than 29%). For Amazon and Facebook, the difference was more than 60%. These numbers represent differences in valuation of several hundreds of billion dollars! It is hard to believe that the business value of these companies changed so much over a single year. It is more likely that for each of them, at least one or both of these prices were plainly wrong. And those are the most studied companies on the planet.
I don’t want to go to the other extreme and say that markets are absolutely inefficient all the time. We have shown that ineffiencies do occur, but on the other hand, very often market prices seem to make sense. Sometimes markets are pretty efficient, and sometimes they aren’t. What would explain this behavior?
The Drivers of Market Efficiency
The wrong way to go at it would be to say: “Well, the market is made of human beings, and people are irrational, so the market is irrational.” Since the advent of behavioral finance - and especially the work of Daniel Kahneman and Amos Tversky - we know that the human brain is subject to various cognitive biases. These prevent us to behave in a completely rational way. But it does not matter if people are irrational, what matters is if they are all irrational at the same time in the same way. Let’s illustrate that with the story of Galton’s Ox.
In More than you know, Michael Mauboussin writes:
In a 1907 Nature article, “Vox Populi”, Victorian polymath Francis Galton describes a contest to guess the weight of an ox at the West of England Fat Stock and Poultry Exhibition in Plymouth. He collected 787 participants who each paid a sixpenny fee to participate (a small cost to deter practical joking). According to Galton, some of the competitors were butchers and farmers, likely experts at guessing the weight. He surmised that many others, though, were guided by “such information as they might pick up” or “by their own fancies”.
Galton calculated the median estimate - the vox populi - as well as the mean. He found that the median guess was within 0.8 percent of the correct weight, and that the mean of the guesses was within 0.01 percent. To give a sense of how the answer emerged, Galton showed the full distribution of answers. Simply stated, the errors cancel out and the result is distilled information.
Mauboussin reiterated the experiment in 2007 by asking his class at the Columbia Business School to estimate the number of Jelly beans in a jar. While the actual number was 1’116, guesses ranged from 250 to 4’100, with an average error of 700 - in other words, students were awful estimators. But the average guess was 1’151 (only 3% off the correct answer), and only two of the 73 students guessed better than the class average.
Even if humans are irrational, there are certain conditions where a human gathering can generate a “Wisdom of the Crowds” phenomena - the crowd solves a problem better than most individuals. On the other hand, we have shown that in other situations, the same crowd can fall victim to a “Madness of the Crowds” mechanism, in particular in times of bubbles and crashes. So what are the drivers of market efficiency?
To be efficient, markets need:
- Numerous participants and diverse opinions.
- An aggregation mechanism for these opinions.
- An incentive for each participant to get it right.
The market price mechanism is how we aggregate all participants’ opinions. Participants need to be incentivized to guess the “right” price, otherwise any guess is as good as any other. Finally, having numerous and diverse opinions allows for errors to cancel out and the market price to get as close as possible to assets’ true value. When these three criteria are met, markets are as efficient as can be. The interesting question is then: to which extent can we breach these criteria?
Let’s get out of the way the aggregation mechanism because it’s the hardest criterion to breach and such a breach would happen very rarely. So rarely, in fact, that I could not find any example for this. I could imagine that someone would be able to purposefully “rig” a market, but market rigging is a crime in most jurisdictions. Although a failure is theoretically not impossible, we can consider that, in general, markets do an outstanding job at aggregating participants’ opinions.
When opinions become scarce
On the other hand, a lack of diverse opinions is much more common. Nowhere is it more common than during bubbles and crashes. When asset prices have been going higher for a long time in a bull market, greed tends to take over rational thinking. Social proof is getting insidious: people watch their neighbor getting wealthy in the stock market and want to participate. Everybody thinks there is only one direction for asset prices: up and to the right. This mechanism feeds into itself in a reinforcing loop and prices go parabolic. At this point nobody is considering actually losing money in the market; prices only go up! Pessimists are loudly criticised (and often labeled as anti-patriotic) and diversity of opinion is as thin as can be. The result is clear: prices diverge materially from asset values and overshoot.
Bear markets and crashes display similar characteristics: everybody has been losing money for some while, and many people want to get out of the market. Some are forced to sell their holdings because of financial leverage playing against them. The public in general don’t want to get in: everybody knows some uncle who lost so much money in the stock market. This also feeds into a self-reinforcing loop. Prices go lower and lower, and people become even more pessimistic, driving prices even lower. The few individuals going against the grain, saying that those prices are a once-in-a-generation buying opportunity, are publicly called fools. Here again, diversity of opinions becomes scarcity of opinion. Prices diverge from asset values and everything is cheap.
Bubbles and crashes are the two obvious occasions where diversity of opinion is lacking. Can we find more examples? Well, consider this statistic: the average holding period for a stock on the New York Stock Exchange is 8.5 months. According to a Reuters article, it even reached a low of 5.5 months in 2020. If you have read one of my previous articles, you may recall that more than 75% of the value of a company resides in what happens after the next ten years. But are most investors interested in what happens to a company after the next decade? I don’t think so. With such a short holding period, they are, at best, interested in the results of the next 2 to 3 quarters, and will sell afterward. We have a hyper-discounting of distant cash flows - to the benefit of what is happening right now in the near future. If true, consider what this would mean for quality companies. They usually feature a good return on invested capital and large opportunities to reinvest profits. They are most likely to show enormous compounded profit in the distant future, provided they have a high barrier to entry. But because these profits are hyper-discounted (investors’ behavior shows that they are more interested in what happens this year than in the next ten and beyond), these companies’ stocks are likely to be systematically underpriced.
True, this number is highly impacted by high-frequency trading - there are a lot of investors who keep their stocks for much longer periods. But consider a thought experiment where the investing population is made of two tribes: pure buy-and-hold investors on one hand, and high-frequency traders on the other hand. Who would generate most of the trading activity? High-frequency traders. Therefore, who would set most prices? High-frequency traders. On which basis would those prices be based? a) Long-term cash flows, or b) for what traders expect to sell their stocks in the next ten minutes? I’ll let you answer this one. Obviously, the real investing population is more diverse than in this thought experiment, and holding periods for each participant will fall on a continuum. Nevertheless, an average holding period of less than a year for the whole population is still exceedingly low.
The Principal-Agent Problem
The last market efficiency criterion is that participants need to have an incentive to get it right. At first sight, this is an easy requirement. Every investor wants to make money in the stock market, so there is nothing to look at here, correct?
Well, not so fast. Investors who invest their own money directly do want to get the best returns possible. But what about people taking investing decisions on behalf of investors? Here I am talking about fund managers and portfolio managers who often have a mandate by their clients to manage their money on their behalf. Most of them do manage their clients’ money with the best intentions, but can we be sure it is always the case?
In a 2020 Morningstar article, Russel Kinnel studied the number of funds in which the fund managers had made a substantial investment of their own money. Because the SEC requires managers to report fund ownership of at least $1million, this was chosen as the arbitrary threshold for the study. Out of an universe of 7’424 funds, only 1’155 had at least one manager with more than USD1 million invested. That means that the managers of 6’269 funds, or 84% of the fund universe, did not invest a significant amount of money in their own fund.
Why would that be the case? Is it because of the arbitrary $1 million threshold - many managers did invest a meaningful amount their saving, but being not wealthy enough, the invested amount falls below the SEC reporting requirement? If so, then why are they not already wealthy managing their own money? Why should external investors trust them with their money when those managers failed to demonstrate an ability to compound their own money to a respectable level of wealth in a first time? If on the other hand, the managers are already wealthy enough, but did not deemed it necessary to invest a substantial part of their wealth in the fund, what does it mean about their conviction in their own ability?
What’s more, their subsequent behavior will likely be determined by how they are compensated: what are the incentives? The standard compensation for mutual funds and ETFs is to charge a fixed annual management fee proportional to the amount of assets under management. In the case of hedge funds, a performance fee might be added, but this is still on top of a management fees. Furthermore, hedge funds assets under management (around $4.32 trillion in June 2021) are an order of magnitude smaller than those of mutual funds ($23.9 trillion in the US in 2020).
So the main compensation in the industry is a management fees irrespective of performance, and most fund managers don’t invest a significant amount of their wealth in their own fund. There is a conflict of interest between principal (the investors in the fund) and agent (the asset manager) - the classical Principal-Agent problem. For investors, the objective is to get adequate returns. For managers, the objective is to raise as much assets as possible (the management fees is charged on an assets-under-management basis). Put yourself in the shoes of the investment management company: how can you double the amount of management fees charged? There are three solutions:
- Double the management fees rate. This is hard to do because there is a lot of competition and the current general trend is to offer investors lower fees.
- Generate enough investment returns to double the assets under management. That would be obviously what investors would prefer, but from the company’s point of view, this is slow and not guaranteed.
- Advertise the fund to more investors so that you can have more assets under managements.
As you will quickly understand, a lot of funds choose the third option. When this happens, the new rules of the game are to get as many funds inflows as possible. The needed skills are marketing and salesmanship, not portfolio management. From the manager point of view, it is far more important to avoid catastrophic returns than to be brilliant. Even if the manager fails to beat his benchmark, fund investors are unlikely to redeem their investment as long as the returns are not horrendous. As a result, the goal for the manager is not to stray to far away from his benchmark. Career risk takes over financial risk.
The resulting asset allocation does not differ meaningfully from the weights inside the benchmark, a behavior called Closet Indexing. According to a 2011 Yale Study, out of a sample of $10.13 trillion of net assets managed by mutual funds, in an additional 28% were managed by closet-indexers (in addition to 16% that were managed explicitly by index funds).The phenomenon was more pronounced for funds domiciled outside of USA, where the proportion of assets managed by closet-indexers rose to 54%! That’s not exactly what I would call an alignment of incentives.
Of course, not all funds fall victims of this principal-agent conflict. Some go even to great lengths to eliminate it. For instance, Nick Sleep and Qais Zakaria, managers of the Nomad Investment Partnership, created a fee structure that would rejoice investors’ hearts:
- A management fee whose sole purpose is to reimburse the running costs of the fund. In the last years of the partnership, this fee amounted to only 0.10% of assets under management
- A performance fee of 20% of annual gains in excess of a hurdle of 6% over the previous year’s high watermark - acknowledging that generating at least 6% returns per year was table stakes.
- Most importantly, if the fund’s current net asset value was lower than last year’s high watermark, any performance fee received in previous year was reimbursed on a pro-rata basis of the misperformance.
With this fee structure, the only way for Sleep and Zakaria to make money was if Nomad generated outstanding results for its investors. With such an alignment of incentives, is it really a surprise if the Nomad Partnership generated 18.4% per year, net of fees, over its 13 years of existence?
Yes, there are managers who really care about getting it right for their investors. But then again, statistics show that not all do, far from it. Given the proportions of closet-indexers, and knowing the weight of mutual funds’ and ETFs’ assets under management compared to those of direct investors, one can ask if the incentive criterion for market efficiency always holds.
Why Indexing is still one of the best strategies for most investors
So far we have spent our time poking holes in the Efficient Market Hypothesis, but at this stage I want to get one big question out of the way: what are the implications for buy-and-hold index investing?
I often discuss with investors whose discourse can be summed up as:
Because markets are efficient, you cannot beat the market. Therefore, if you cannot beat the market, be the market, and pay as little fees as possible while doing so.
Even if by now it is clear that the premise of this argument is not sound, I have good news for passive indexers: The Efficient Market Hypothesis does not need to hold for indexing to still be the best strategy for most investors.
And the reason for this is purely arithmetic. In Value Investing, Bruce Greenwald masterfully explains:
The average return earned by all investors, weighted by assets owned, in any asset category must equal the average return on the assets that make up that category. For example, the total of the returns that investors in US stocks earn in any given period must be equal to the total return produced by US stocks in that period. All these stocks are owned by somebody, and any related derivatives net out (e.g for each short seller, who does not own the shares in question, there is a corresponding buyer of those non-existent shares). Since the total value of stocks at any moment must also equal the total value of investors’ stock holdings, the average percentage return earned by investors in US stocks must equal the average percentage returns produced by the US stock market as a whole - the market return. This means that if some investors outperform the market in question, other investors must underperform by an equal amount. Before transaction costs, security trading is a zero-sum game; with transaction costs included it becomes negative-sum.
Said another way, only twenty percent of the people can be in the top fifth. Let’s get a sense of this graphically. Let’s imagine a investing population, whose returns cluster around an average market return, before fees:
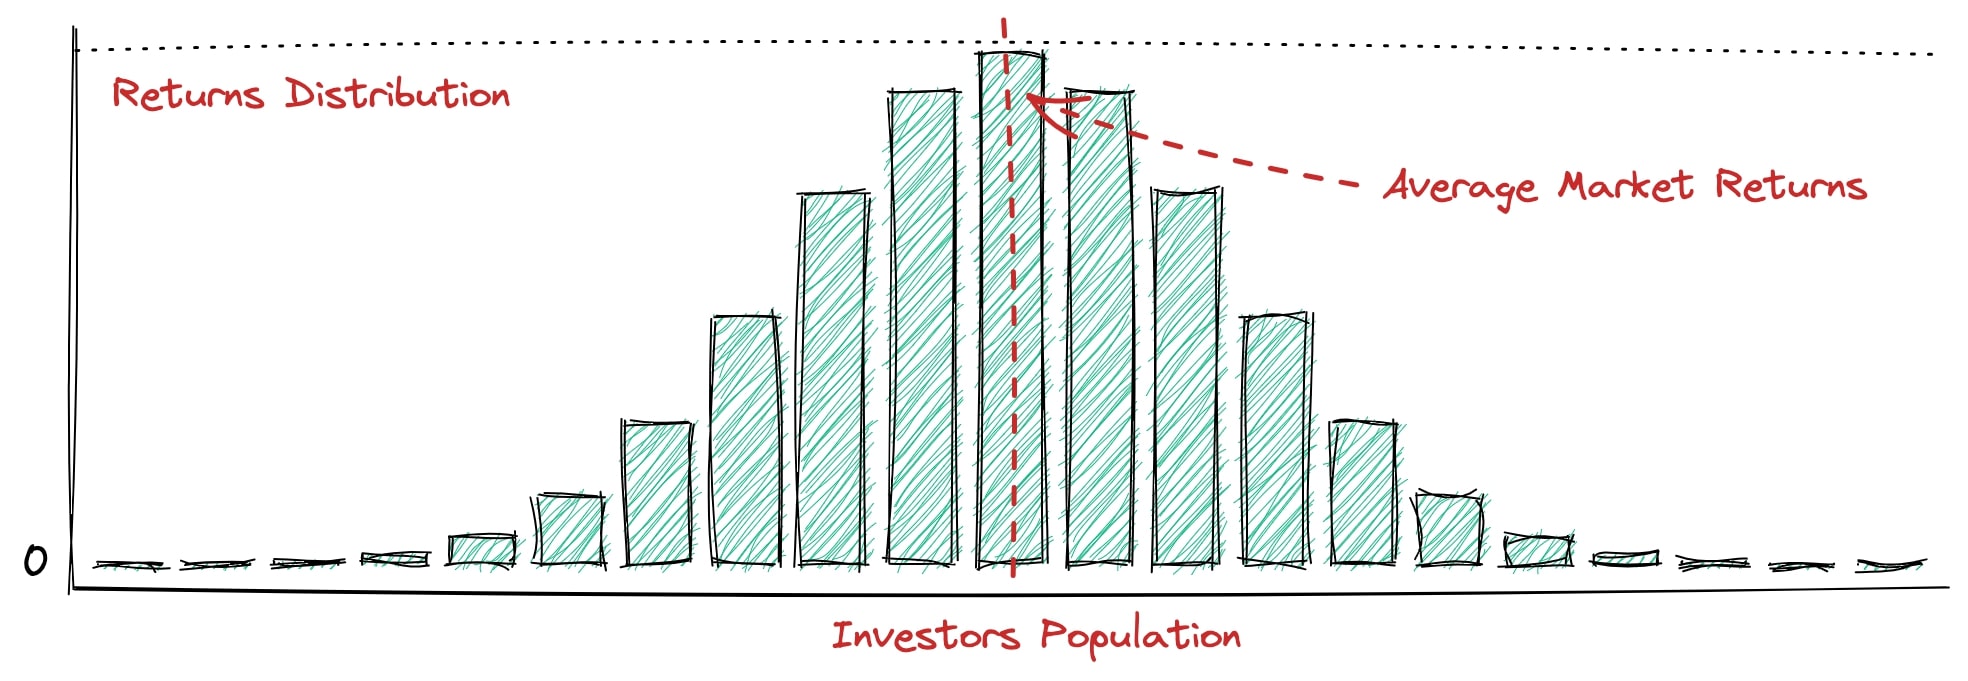
The distribution does not need to be Gaussian, but it won’t change much to the argument. Here we have approximately half of the population enjoying above-average returns, and half of the population getting below-average returns.
Now add the effects of both passive indexing and closet-indexing: many more investors will either get market returns or close-to-market returns (we are still on a pre-fees basis). What this means is that the population will be even more clustered around the average market return (i.e, the standard deviation will be smaller):
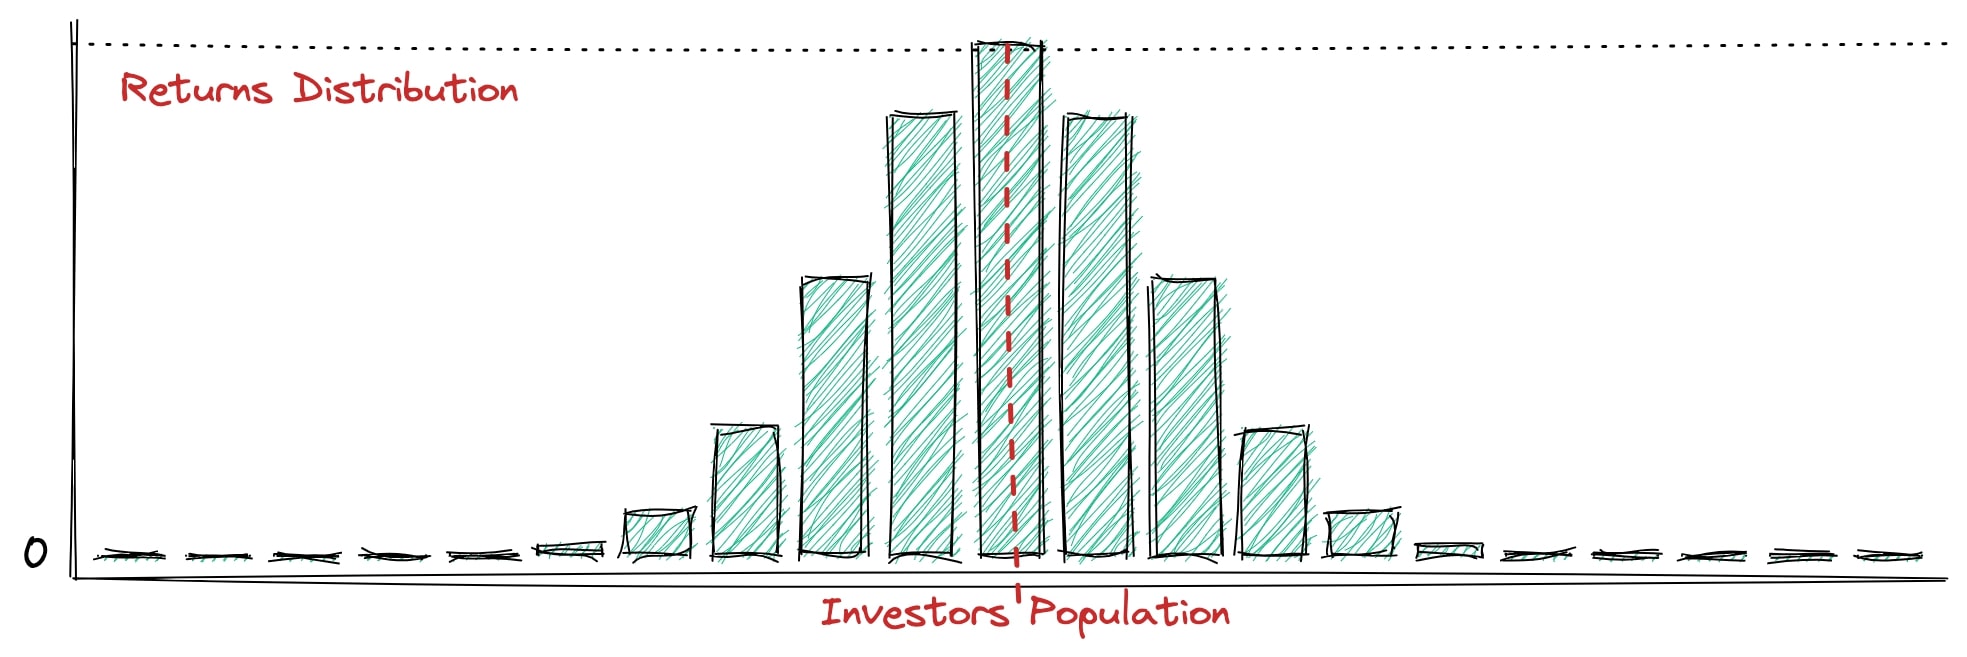
We still have around 50% of the people beating the market and 50% underperforming. Now let’s introduce fees in the picture. Transaction fees, management fees, performance fees, custody fees, you name it.
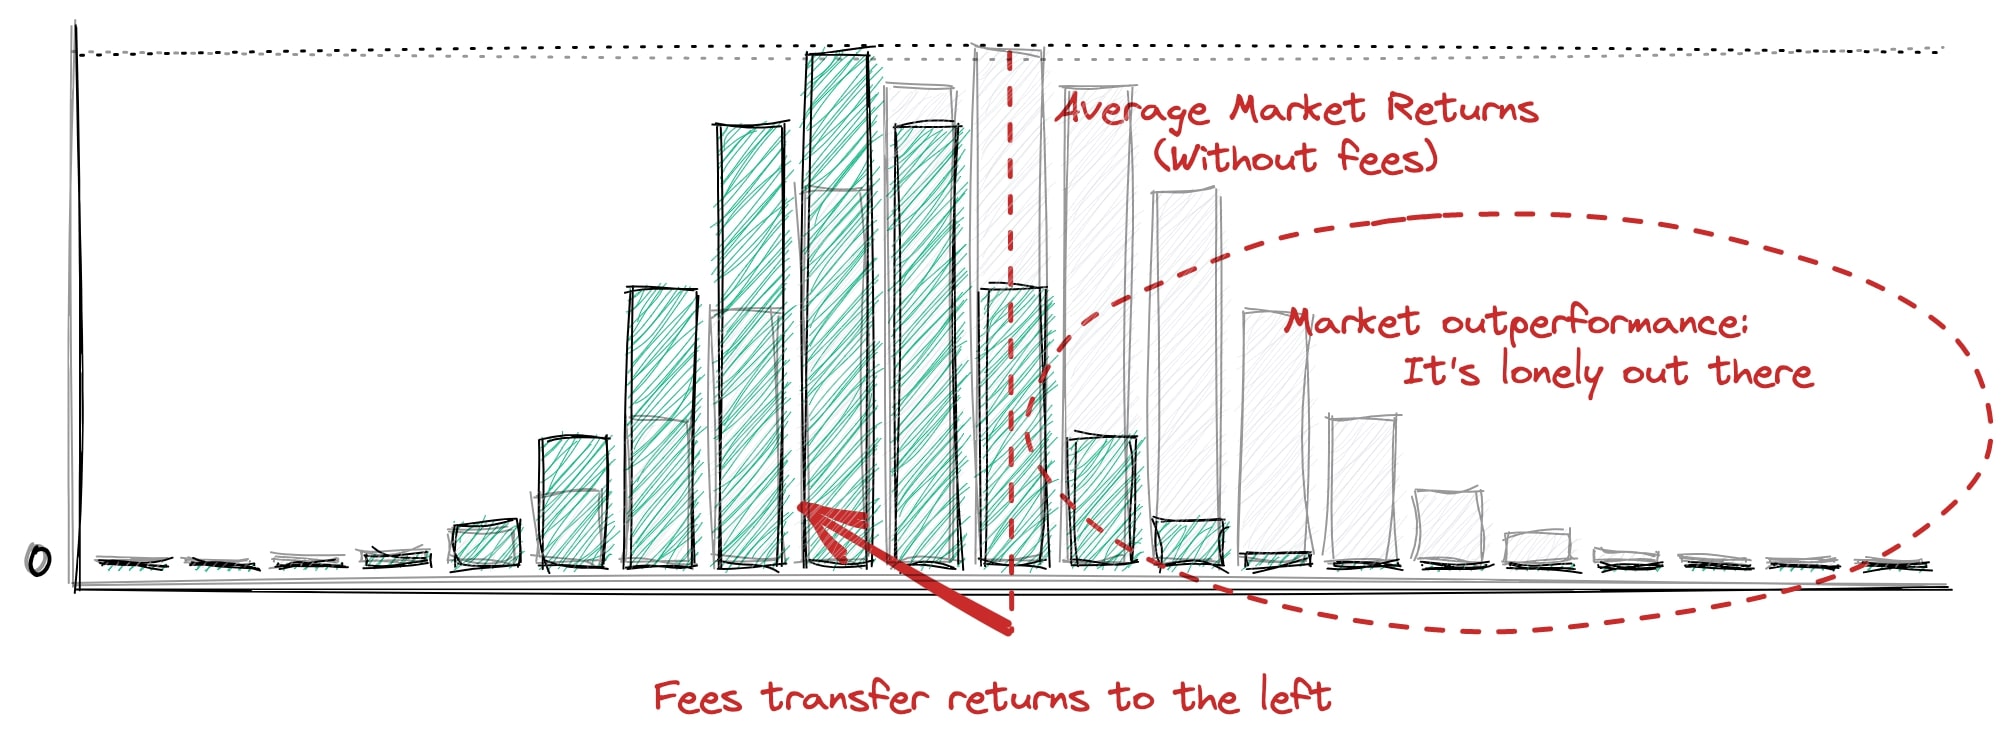
The fees will translate everybody’s returns to the left hand side (note, in the background in grey, the distribution from the first graph). The combination of fees and exaggerated clustering has decimated the population of outperformers. Intuitively, outperformers went from being 50% of the population to becoming a much tinier tribe, maybe 10%. This intuition is confirmed by statistics: according to S&P SPIVA reports, between 2001 and 2020, 86% of fund managers failed to outperform their benchmark. Framed another way, only one out of seven managers provides superior returns. It’s not an impossible task, it happens quite often indeed (see the hall of fame above), but it’s clearly a minority.
That’s why low-cost index funds are still the best solution for investors who don’t want to spend too much time thinking about investing. They are still pretty sure to get returns superior to those of most active investors.
But they should take notice that this superiority is only on a relative basis - it does not say anything about the absolute performance they will get. The market may be rational or not, and the whole asset class may be headed upwards or downwards. With the EMH, passive investors thought they were getting the “correct” price supposed to match their opportunity cost. Now without the EMH, they only know they will get market returns, whatever these are.
What is left for the active investor?
Market efficiency is a paradoxical topic. We have shown that markets can be quite inefficient, but nevertheless very few people manage to beat them - only 1 out of 7 fund managers achieve this performance. Let’s put ourselves in the shoes of an aspiring investor. What lessons can he take if he wants to be a successful one?
Well, let’s start with what he should not do. As we have seen earlier, he should avoid to find himself in situations where there are numerous participants with a great variety of opinions, all participants want to get it right and the market can aggregate those opinions through its price mechanism. That’s when the market is most likely to be efficient, and our investor is better off investing in a passive low-cost index fund.
This also holds if he is unable to tell if he his in such a situation or not. As goes the saying, “If you’ve been playing poker for half an hour and you still don’t know who the patsy is, you’re the patsy.” That’s the same with investing, our investor will need an edge - by finding situations where one of the three criteria for market efficiency is broken. This edge can come in a variety of flavours.
- Informational edge: you have an information that nobody else has. This is very unlikely to happen, most of it is insider trading and illegal.
- Analytical edge: given public information, you have a better insight than everybody else. Very hard to do when markets are efficient, but when combined with other sources of edges it acts as an amplifier.
- Structural edge: you can go where other investors won’t go, don’t want to go or aren’t allowed to go. A few examples:
- Microcap investing: most institutional investors cannot invest in micro capitalisation because of liquidity and regulatory constraints.Imagine a fund managing USD 1 billion of assets and a small company whose market capitalisation is only USD 50 million. Let’s say that the fund wants to take a position in the company, and make it 2% of the fund. 2% of USD 1 billion is USD 20 million, which represents 40% of the market capitalisation of the small company! The fund won’t be able to acquire its stake without moving significantly the price of the company. Let’s say it proceeds anyway to acquire its stake. With such a material ownership in the company it will have to represent the fund at the board of directors and influence operations. Finally, it’s not even clear if regulatory authorities will approve such a material ownership. So much hassle for a 2% position is not worth it. No wonder no institution will go into this area. The lack of participants (and thus of opinion diversity) makes it a fertile ground for good investment returns.
- Making sure that you have a long-term horizon when most participants have a short-term one. I have already discussed above how this creates an advantage for investors in quality companies. Another good example would be how Warren Buffett structured his investment vehicle. Instead of creating a fund or an investment partnership (as he was used to do in the 1950s), he structured Berkshire Hathaway as a holding company. In a fund, when an investor wants to redeem his investment, the fund manager has to sell some of its positions to return the capital. In Berkshire, if an investor wants to redeem, he can sell his shares on the secondary market and Buffett won’t have to sell anything. This allowed him to take very long-term positions in outstanding businesses. (There are other advantages to the structure of Berkshire Hathaway. Most notably, the conglomerate owns a lot of insurance companies, and Buffett uses the insurance float - i.e the cash received in advance of claim reimbursement, which behaves like a revolving fund - as a leverage to buy more stakes in other businesses.)
- Spin-offs and special situations. When a listed spins off a subsidiary, it often happens that the spinoff is materially smaller than the mother company. So small, that in a lot of cases portfolio managers receiving the spinoff will have to sell their stake - either because they don’t want to get the hassle of analysing a micro position in their portfolio, or because their mandate prohibits such holdings. Whatever the reason, this often results in a period of forced selling from institutional participants and the stock of the spinoff is temporarily depressed. This is a situation where a) other participants don’t want to get it right, and b) have only one opinion: sell, sell, sell! Although this phenomenon is less pronounced in recent years, spinoffs have been documented to generate material excess returns in the one to three years after having been spun off.
- Finally, the investor can also have a behavioral edge: he is able to overcome his human nature and the various biases other people fall victim to. For instance, he is able to buy when everybody else panics, and sell in bubble territory. It looks nice on paper, but very few people are able to override their genetic wiring. They may have a different genetic disposition, and genuinely enjoy to go against the grain. But most of us are the descendants of the guy who, 50 million years ago in the Savannah, ran the hell out of there when he saw something moving on the horizon - rather than stopping and asking if it was a lion, an antelope, a fellow human or something else. Even Daniel Kahneman, who spent his whole life studying cognitive biases, happily acknowledges that he is no better at avoiding them than anyone else. Going against your wiring is hard and emotionally taxing. Another way to go at it is to implement automated investment processes where humans don’t have to participate. This is what quantitative investment companies like O’Shaughnessy Asset Management do: humans provide value by doing market research and creating investment algorithms, not by taking daily investment decisions.
Markets may be inefficient, but the laws of arithmetic are such that most investors won’t do better than average. While most people will be better off investing in low-fees index funds, investors wishing to generate above average returns will need to build a consistent and repeatable edge.